Understand what keeps users engaged

Measure feature usage, find conversion bottlenecks and see which users return. Autocapture gives you the activity history to explore without defining every event up front.

Trial setup funnelTrial accounts, last 30 days, 7-day window
Signed up1,240100%Created a project86870%Imported data43435%Invited a teammate29824%
Biggest drop: Imported data. Half of the people who created a project stopped there. Watch the 434 sessions

A trial setup funnel and its biggest drop. Sample data.

What you do

Install once, label later

The snippet autocaptures clicks, inputs and form submits, with what people type masked. When you decide a click matters, give it a name in the dashboard or with the visual builder: labelled events and tagged pages apply to data you've already collected.

Send your own events from the SDK or the HTTP API when you need more detail.
Simplified install snippet. Your workspace's snippet includes its own token.

What you measure

Answer the everyday product questions without exporting anything.

Trends

How often is a feature used, and by whom? Chart any event or page over time, split by any property.

Illustration: weekly users of a feature compared with visitors to its page.

Funnels

Lay out the steps to value, from 2 to 10 of them, and see where people drop out and how long they take to convert.

Illustration: a four-step funnel from signup to sharing a report.

Retention

Do people come back? Compare cohorts by signup week to see whether a change to onboarding is sticking.

Illustration: weekly retention for four signup cohorts.

Paths

See what people do before or after any event, including the routes you didn't design.

Illustration: the three most common next steps after opening billing.

Heatmaps and frustration signals

Click maps show where attention goes on a page. Rage clicks and dead clicks point at the places where people expected something to happen and nothing did.

Illustration: a click heatmap over an app page, with a rage-click count.

Dashboards and content analytics

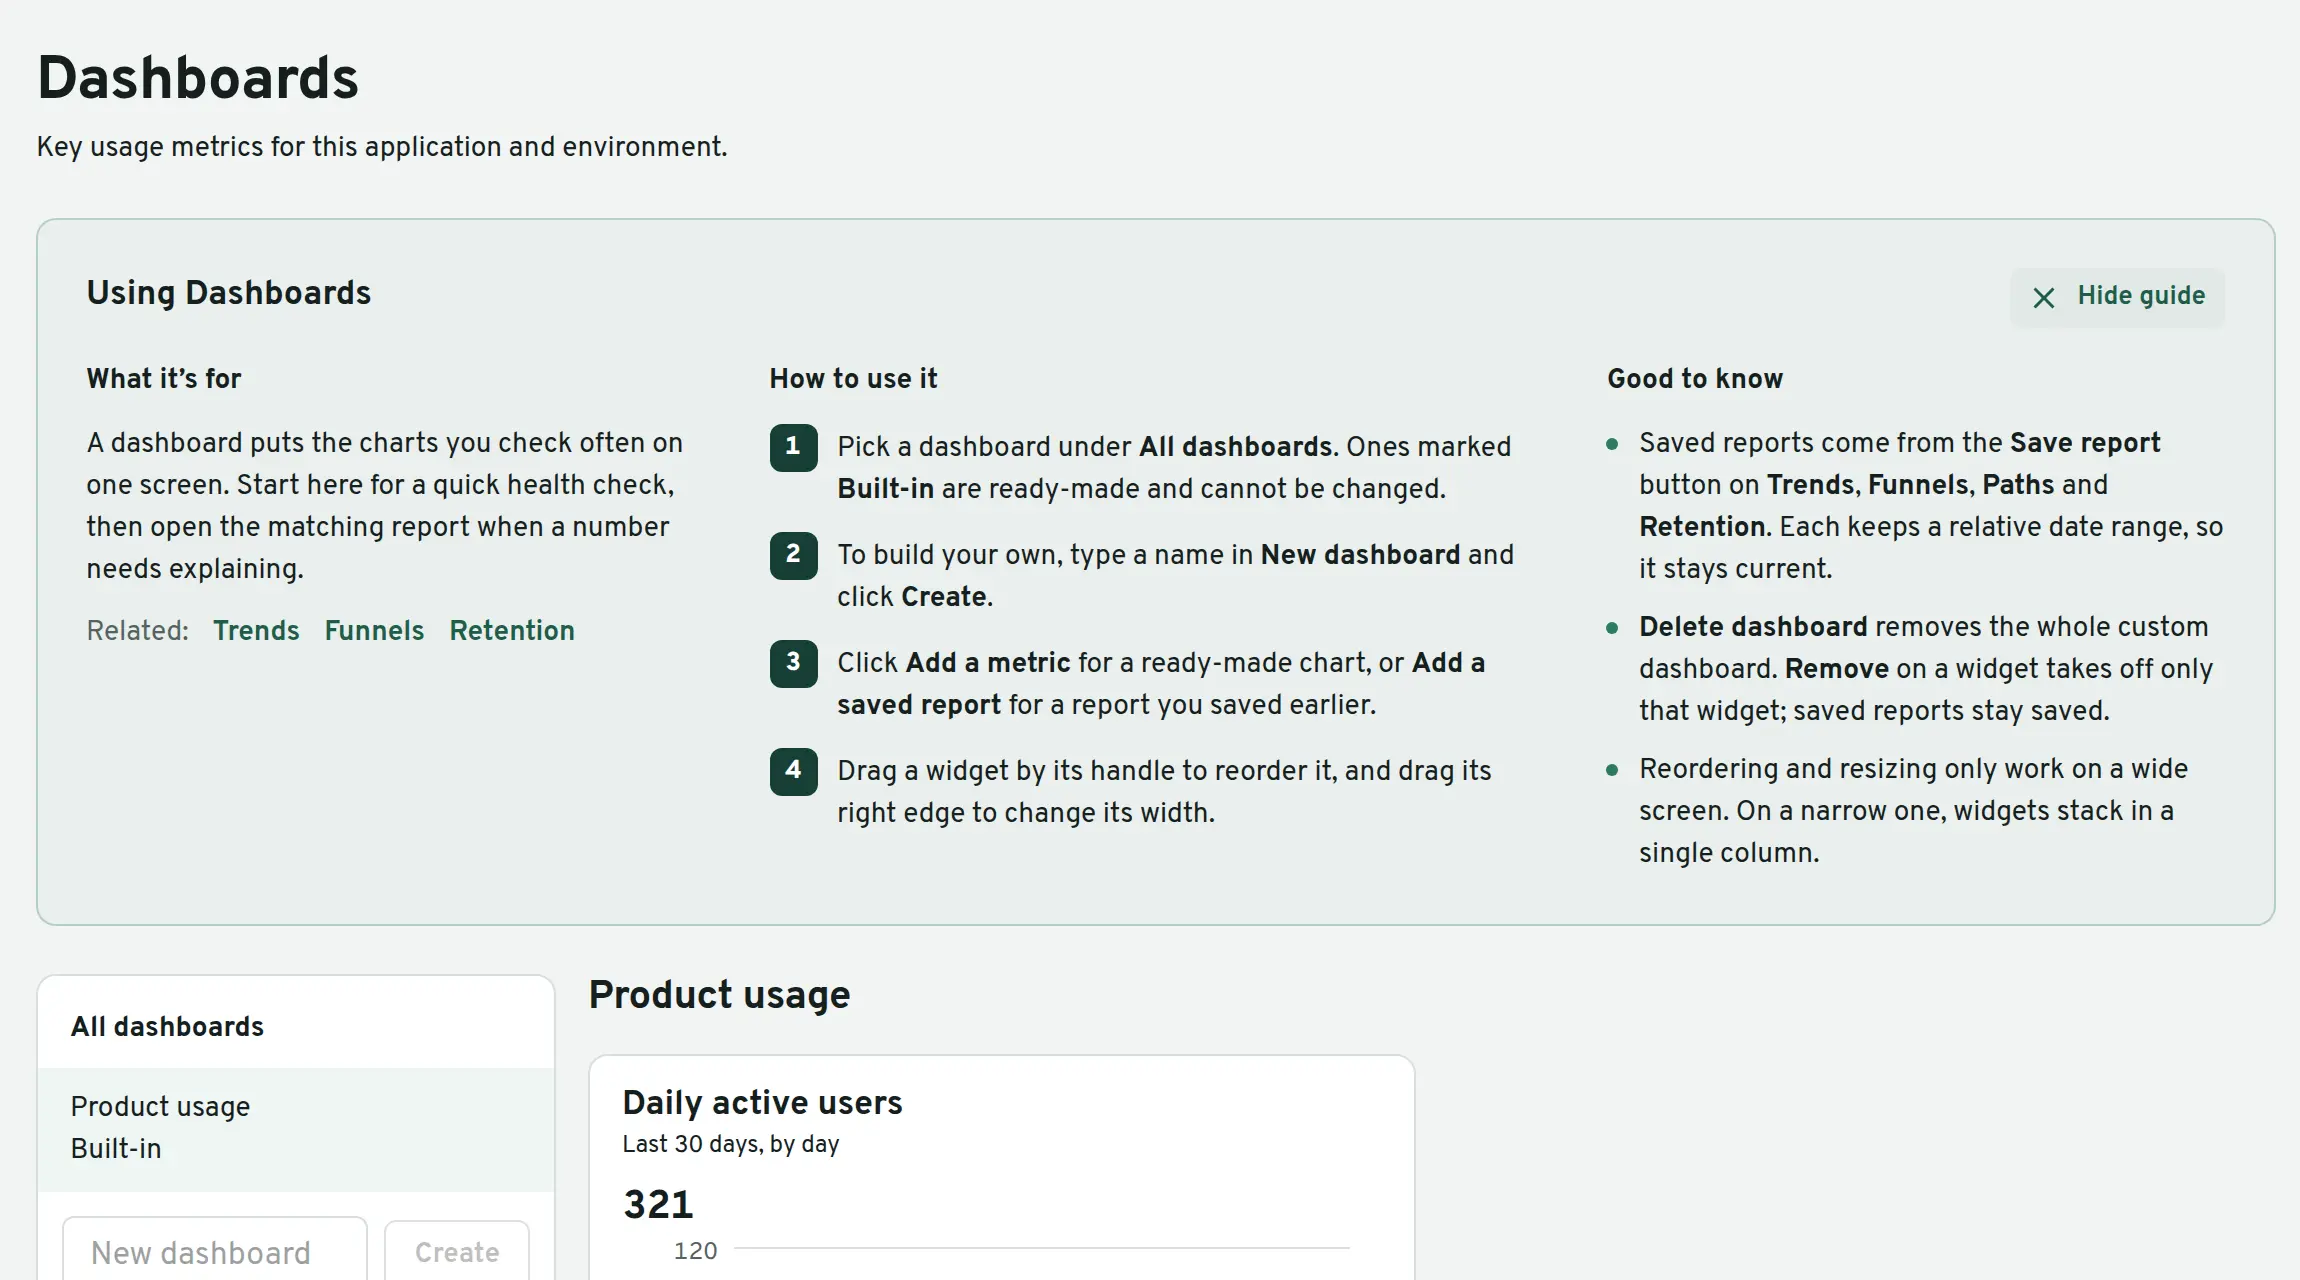
Pin the charts your team checks every week to a shared dashboard. Every flow, checklist, survey and card reports its own views, completions and goal conversions, so engagement and analytics are never two separate stories.

The Dashboards screen in Kitetrail, with its built-in guide and a daily active users chart.

Your data, where you need it.

Send data in from Segment or RudderStack, sync to your own S3 bucket, and receive webhooks when things happen. Forwarding browser events to other analytics tools is coming soon.

TURN PRODUCT INSIGHTS INTO GROWTH

Build a product
users come back to.

Start improving activation, adoption and retention with Kitetrail.

Start your free trial

14 days free. No credit card needed.